Debugging your Project
Builder provides a debugger interface which can be extended for various languages. Currently, there is support for the GNU Debugger which supports C, C++, and to some degree Rust, and Vala.
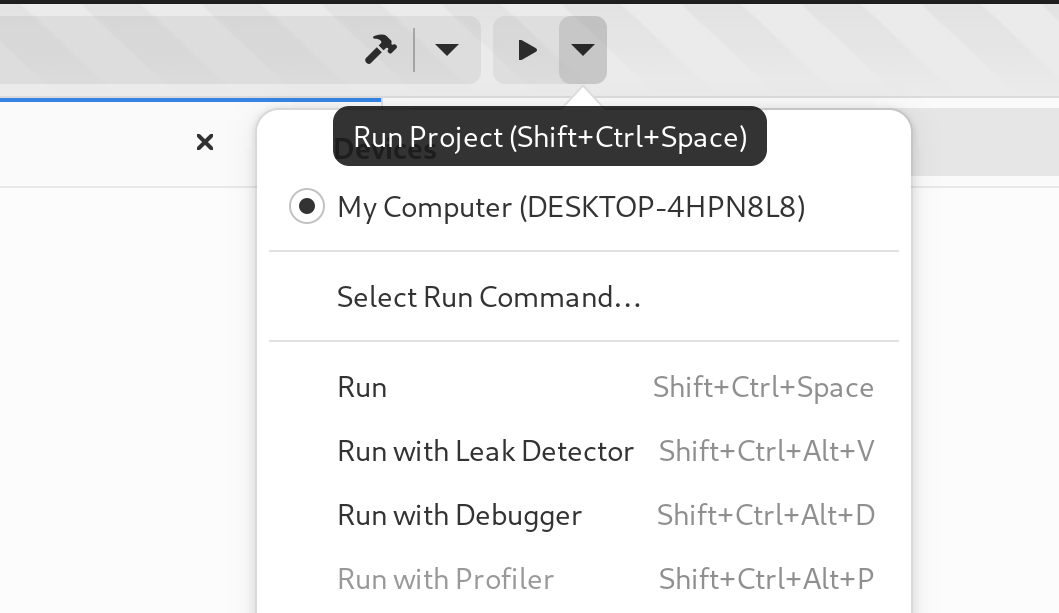
To start the debugger, select “Run with Debugger” from the Run button.
Warning
If Builder fails to locate a debugger that is compatible with your project, an error message will be displayed.
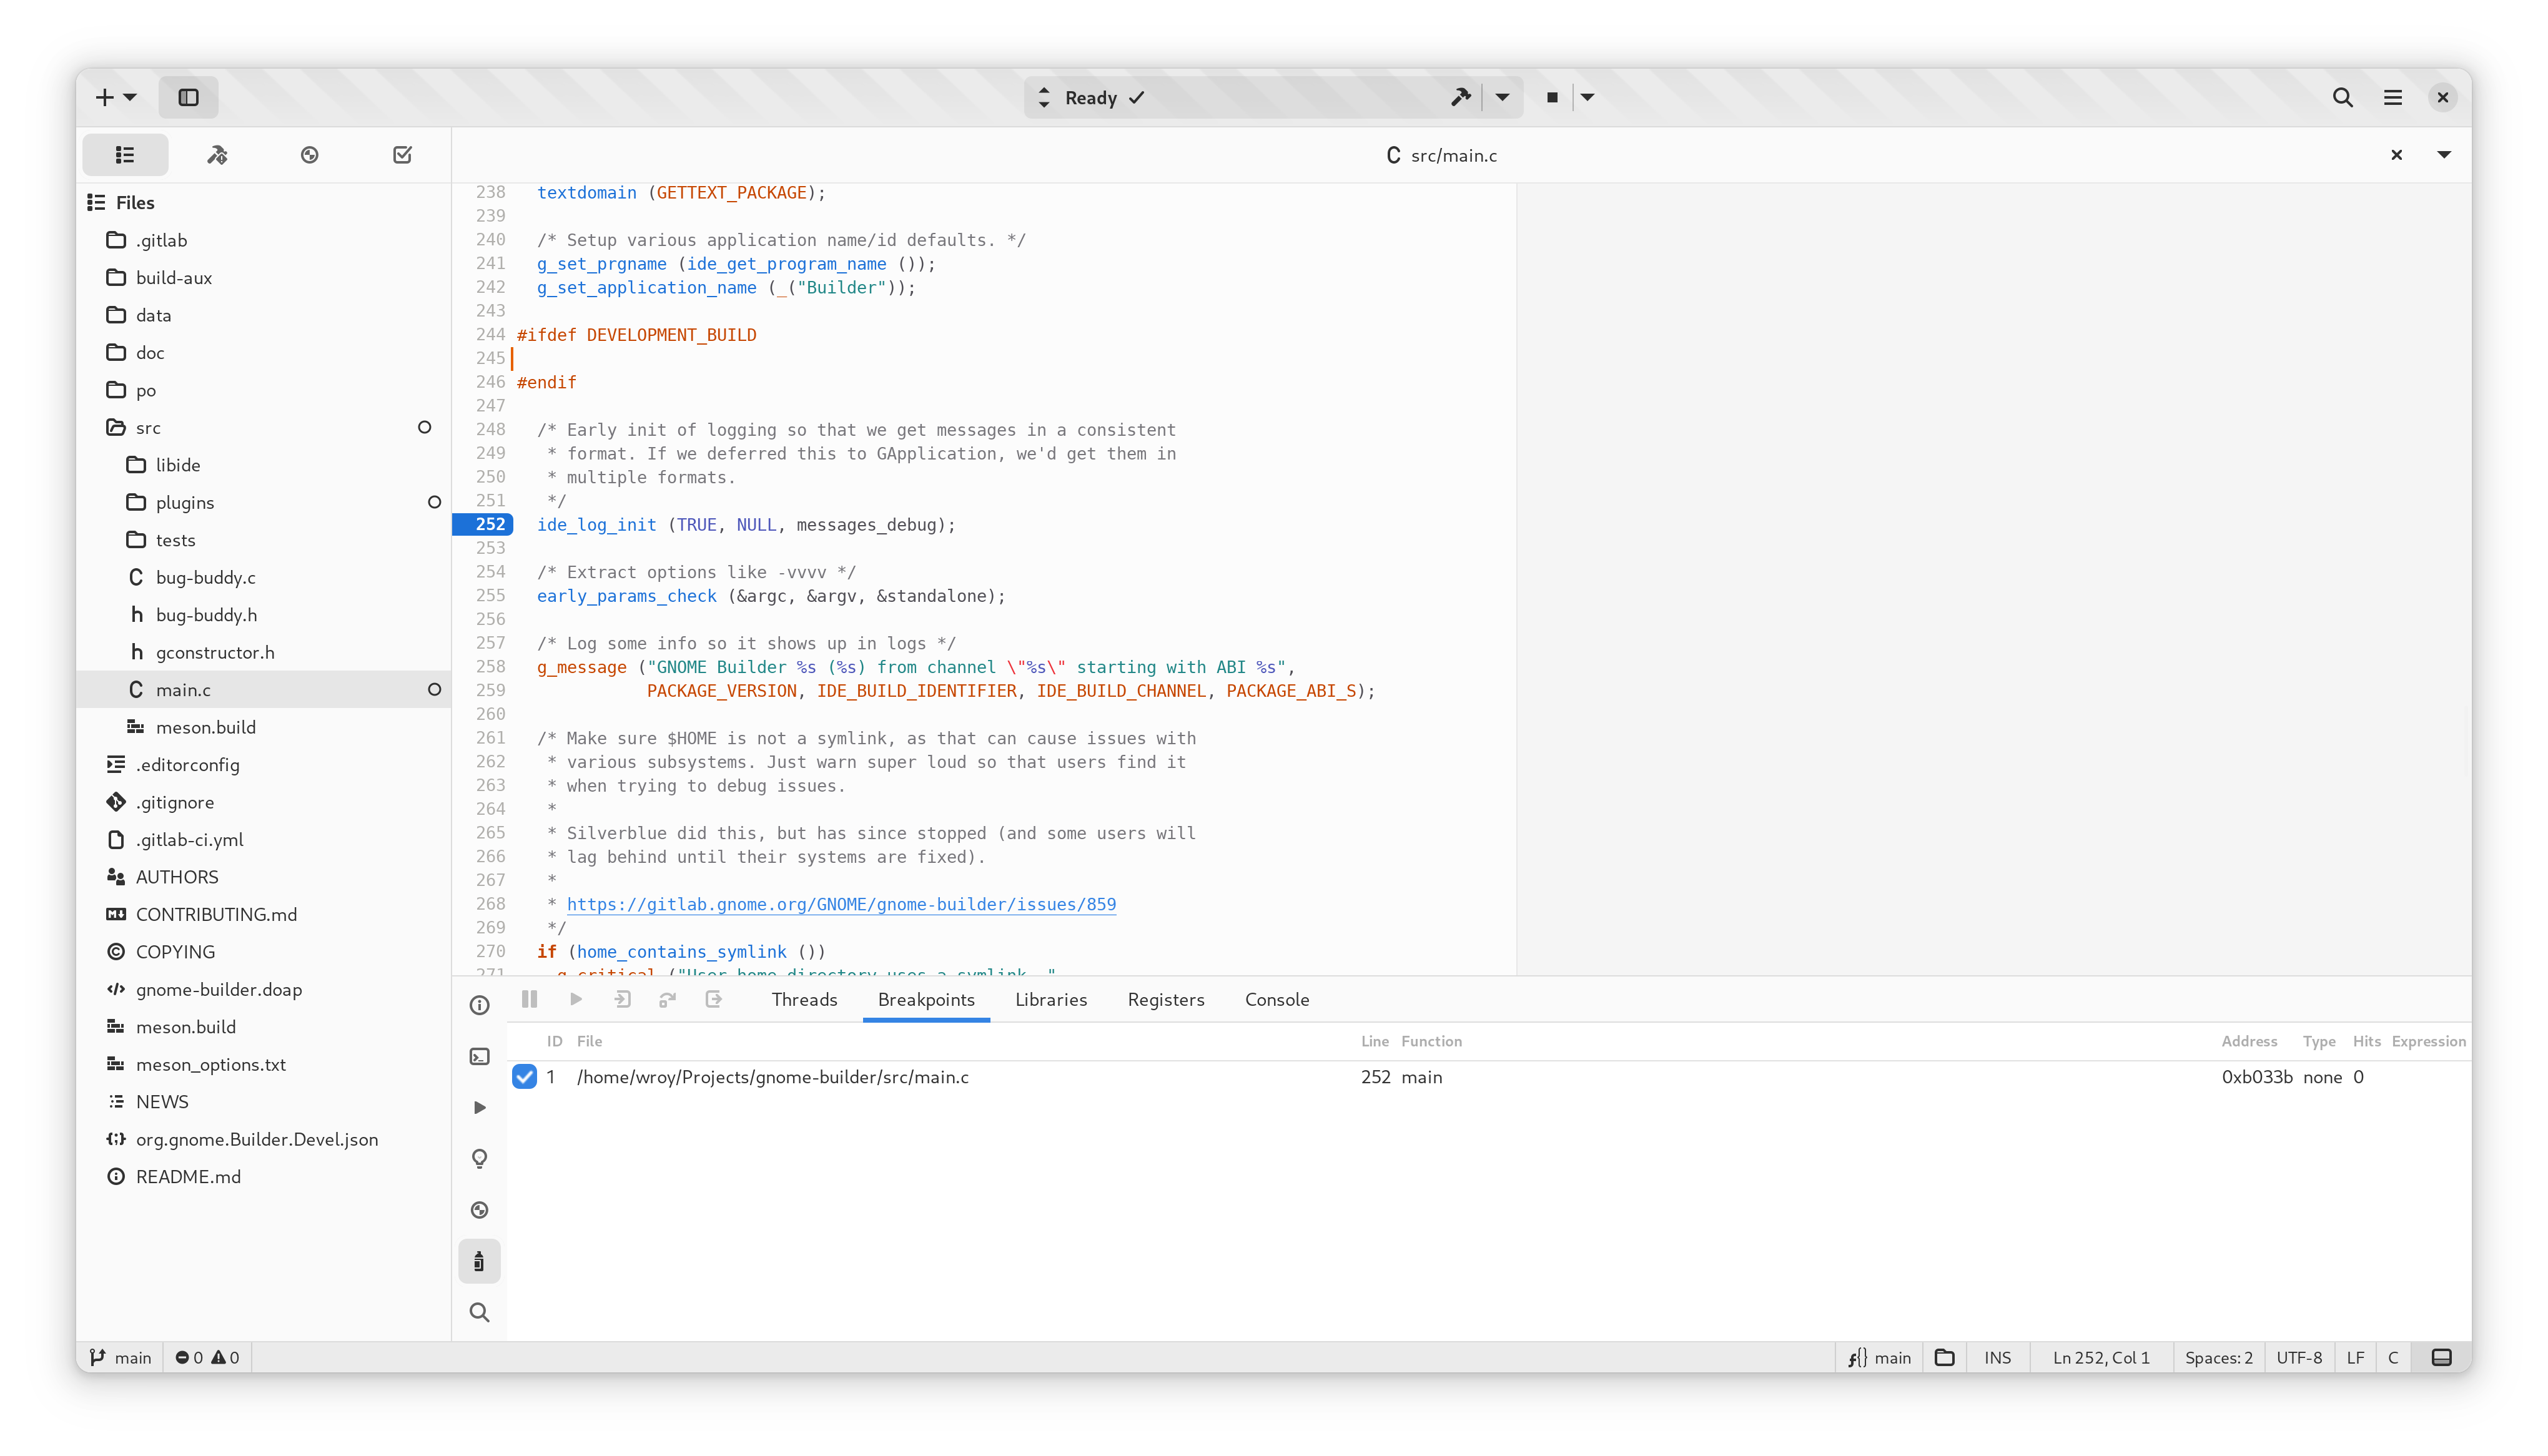
After Builder has started the debugger, you’ll be greeted with a series of controls to step through your application.
Note
The debugger support in Builder is currently limited, and will be expanded in future releases.
You can currently do a few things with the debugger in Builder.
- Step through execution in a variety of fashions
- Browse threads and thread stacks
- Explore current register values
- View the values of locals and parameters
- Add and remove breakpoints to aid in stepping through execution
- View disassembly when no source is available